Easy Maps on the HBRG website
A few years ago the Highland Biological Recording Group published an atlas of bumblebee in the area (Macdonald, M. & Nisbet, G. 2006. Highland Bumblebees: Distribution, Ecology and Conservation. HBRG, Inverness). It was always our intention to publish annual updates on our website, so for a couple of years I went through a laborious process of generating updated maps and preparing a pdf file which could be downloaded from the site.
Then I read about NBN Web Services, and saw a way to make my life easier. I wanted to be able to display the current NBN Gateway maps for Highland only, using only our own HBRG records, and with two date-slices colour-coded. Reading the documentation on Web Services grid map was a little daunting, even with a bit of technical background, and I contacted Jim Bacon for some advice. The advice was very quick and helpful. In short, he asked why I would want to use Web Services directly, when the result could be achieved with his mapping widget, which is powered by web services. ‘Why indeed?’, I thought, when I realised that the map I wanted could be generated in a single line of HTML, with (almost) all the flexibility I wanted.
The only thing missing was the ability to limit the display to Highland Council area. Thanks to Jim, that was soon in place, with a parameter that would define our area. Then I had all I needed. Goodbye annual pdfs; hello some simple HTML code that once written need never be changed.
Fig. 1. HBRG Bumblebee records in Highland, with two date classes.
The current maps (to the end of 2009) are visible on our website (Fig. 1). Clicking the species name runs a simple JavaScript routine that displays the relevant map into an ‘iframe’ on the page (an iframe is just a bit of a web page that will display another web page). Only our record set is used, so we can be sure of the quality of the records. All the original records (1990-2005) are shown in blue, and all subsequent records in green. This will give an indication of any expansion in range. When I update the HBRG datasets to the Gateway, the maps instantly show the new maps with no additional effort from me.
Fig. 2. Records of designated species in VC 96.
We have used the Easy Maps widget in other configurations as well. Results of a recent survey for the Highland LBAP are shown on the site, this time zooming to vice-county 96, and using all datasets with no date-slicing (Fig. 2). When Jimmy McKellar updated his article on Beefly, he wanted to have a map of just the Scottish mainland, that species not being known from the islands (Fig. 3). Once again, Jim provided the solution by defining the relevant area. Maps to illustrate our current ant atlas project include two displays of the distribution of the Slaver Ant Formica sanguinea at different resolution and area (Fig. 4). When the map is used like this for a single species, the coding is very simple indeed, with no need even to tackle JavaScript.
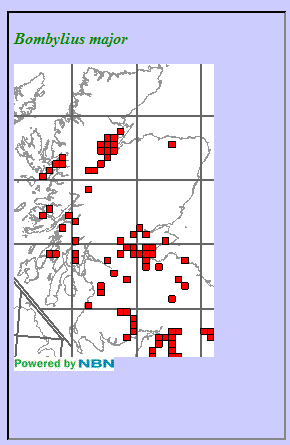
Fig. 3. Distribution of Beefly Bombylius major in Scotland.
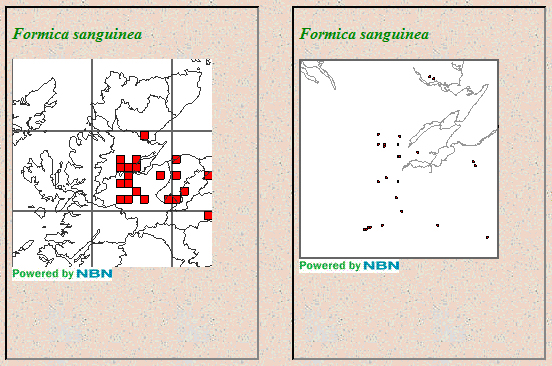
Fig. 4. Distribution of Slaver Ant Formica sanguinea in Highland at 10km resolution, and in 100km square NH at 1km resolution.
If you find yourself creating maps, placing them as graphics in your website, and then repeating the exercise every year as new data come in, consider saving yourself a lot of work by customising your display with Easy Maps. The documentation is available at www.brc.ac.uk/resources.htm. The examples on the HBRG site (which do not cover all the possible customisation) may give you ideas for your own site. You can even pinch the code and adapt it if you want – we have all done that at some time! We will certainly expand our use of the utility in our general web content, and for specific purposes. We plan to publish atlases of ants and mammals in the next year, and to provide live updates of the maps just as we have already done for the bumblebees.
The whole spectrum of resources on the NBN and BRC websites is well worth scouring for labour-saving goodies. In the course of writing this article I happened on the Vice County grid square generator at www.brc.ac.uk/vcList.asp. I wish I had known about it before I made up my own version, but it will certainly come in useful in future.
We are very grateful for the help and advice given by Jim Bacon in adapting the Easy Maps widget to our requirements.
Written by Murdo Macdonald (HBRG webmaster and database manager)
You can find articles on Easy Maps published in NBN News 36 and NBN News 34.